Climate Science Refresher

Amidst the clamour for action on climate change and alignment with “science-based” targets, it’s occasionally helpful to step back and remind ourselves what the science is saying.
Two recent publications provide a comprehensive basis for that narrative. The first is the IPCC’s 6th Assessment Report (AR6) Summary for Policy Makers (SPM). The second, The Climate Book curated by Greta Thunberg, is a compendium of short essays mainly by leading climate scientists, but also by writers, journalists and activists.
This article aims to provide a primer on how our understanding of climate change has evolved and the current evidence base for its main underlying causes - global anthropogenic emissions of various greenhouse gases – and predicted consequences.
Basics
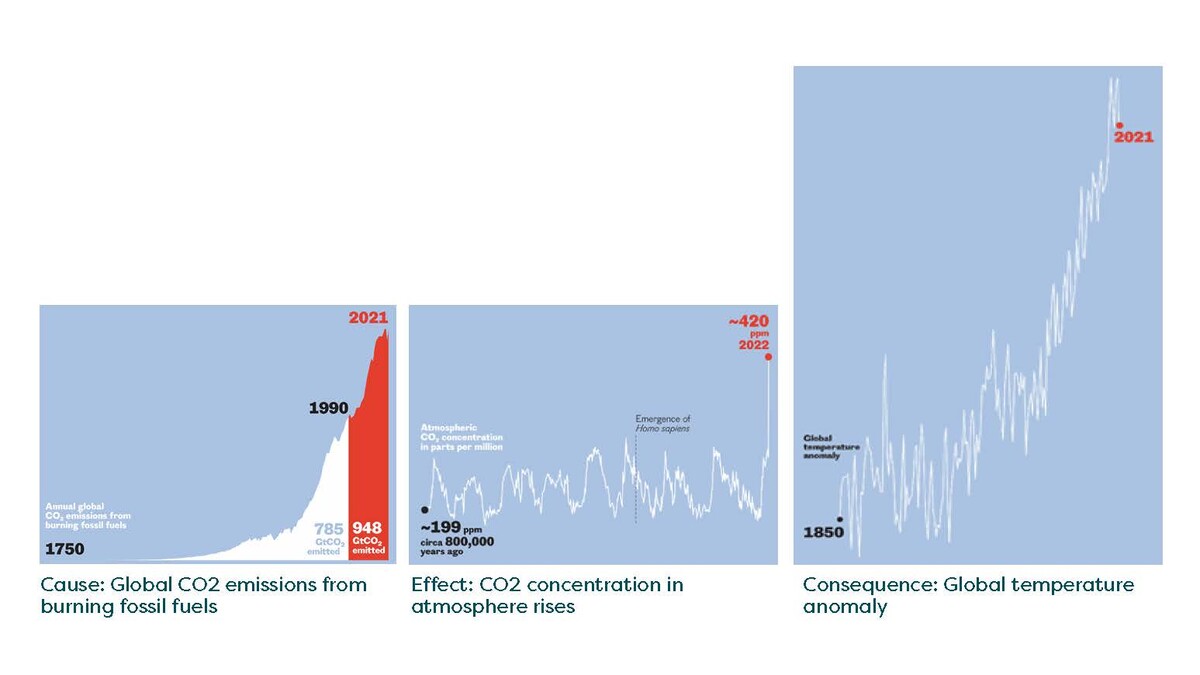
To start at the beginning, in 1896 Svante Arrhenius, a Swedish chemist, and direct ancestor of Greta Thunberg, published a paper hypothesising that by releasing CO2 into the atmosphere through burning coal, humankind would gradually warm Earth by several degrees….….he was only too right. The evidence is apparent from the three graphs below. The scale (and ‘wickedness’) of the existential challenge this sets humanity is perhaps most starkly driven home by the fact that global CO2 emissions in the 30 years since the first IPCC AR in 1990 greatly exceed all emissions in the 240 years prior to that. The signal could not be clearer, but the response so far (at a global level) has not been adequate. And as time passes without a stronger response, even more radical change will become necessary and yet therefore less palatable.
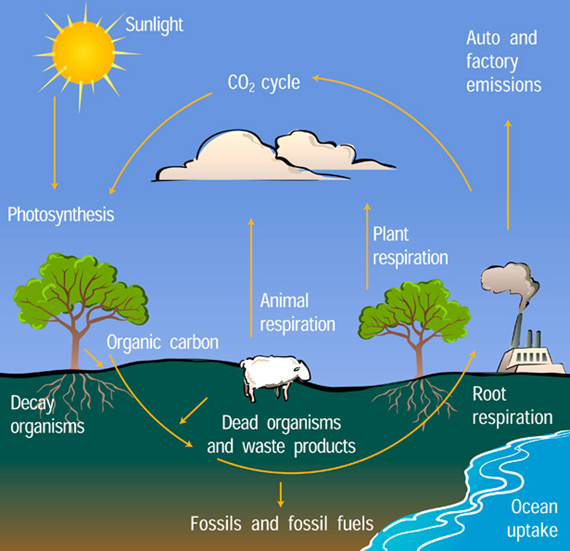
Both the atmospheric physics of global heating and the science of the carbon cycle are complex (see simplified graphic right). One’s immediate reaction to this is to pity the scientists like Arrhenius and those who followed him in the first half of the 20th Century. They had to develop the science of climate change without precision instruments or computers.
Early Learning
In his 1896 paper, Arrhenius estimated that a doubling of the CO2 concentration in the atmosphere would raise Earth's temperature by 5 to 6°C. But at his estimate of 1896 global emission rates, he calculated this would take around 3,000 years. By 1908, the rate of coal burning was already significantly higher and accelerating, so Arrhenius revised his projections and suggested dangerous warming might appear within a few centuries rather than millennia.
However, in the 50 years from the 1900s to the 1950s, the potential significance of the greenhouse effect was disputed by scientists. It was widely believed Earth had a natural balancing process. If CO2 levels were to rise due to industrial emissions, then absorption by the oceans would compensate. It was countered that the thin layer of ocean surface would quickly saturate, and it would take thousands of years for the ocean depths to be exposed. But the rate of ocean surface turnover was unknown. In any case, it was believed that any rise in temperature would allow the air in the atmosphere to hold more moisture, hence creating more clouds that would increase how much sunlight was reflected and preserve the natural balance. The reality was that no scientist of the time could reliably calculate the interactions involving changes of cloud cover, etc. Furthermore, and most strikingly, there was no proof that CO2 concentration levels in the atmosphere were rising. In a 1938 paper, Guy Stewart Callendar, an English engineer was rather a lone advocate of the greenhouse warming theory. He compiled measurements of temperatures from the 19th century onwards, and old measurements of atmospheric CO2 concentrations. He concluded that over the past hundred years (from 1840) the concentration of the gas had increased by about 10% and asserted this could explain an observed warming.
Callendar, G.S. (1938). "The Artificial Production of Carbon Dioxide and Its Influence on Climate." Quarterly J. Royal Meteorological Society 64: 223-40
As for the future, Callendar estimated, on flimsy grounds, that a doubling of CO2 could gradually bring a 2°C rise in some distant future. This was a much lower impact than Arrhenius's estimate, but hindsight reveals that the physics of radiation and climate was indeed too poorly known at that time to quantify the impact of higher concentrations of CO2 in the atmosphere. Although he understood that industrial emissions were already far greater than in Arrhenius's day, Callendar never imagined the exponential climb that would make a doubling possible as soon as the late 21st century. He also hinted that a shift to a warmer climate did not strike him as such a bad prospect. Indeed, future warming was a side issue for Callendar. Like all his predecessors, he was mainly interested in solving the mystery of the ice ages.
In the 1940s and 1950s most meteorologists doubted that the CO2 concentration in the atmosphere had increased at all, deeming Callendar’s old data untrustworthy - measurements could vary with every change of wind that brought emissions from some industrial furnace or forest.
Source: https://history.aip.org/climate/co2.htm
Step forward Dave Keeling
What did occur in the 1950s was a scientific consensus that ocean uptake of CO2 was relatively slow, while emissions were continuing to rise exponentially. So it became clear that it would be theoretically possible if not likely that CO2 concentration levels might have started to rise or would do so soon. Scientists even began to inform the public that greenhouse gases might become a problem within the foreseeable future: continuing exponential growth of industrial civilisation suggested a drastic global warming within the next century or so. Reliable measurements of CO2 levels had become an urgent priority.
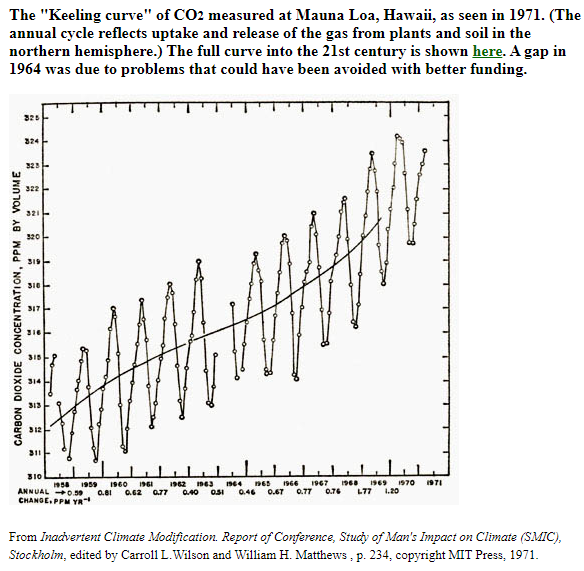
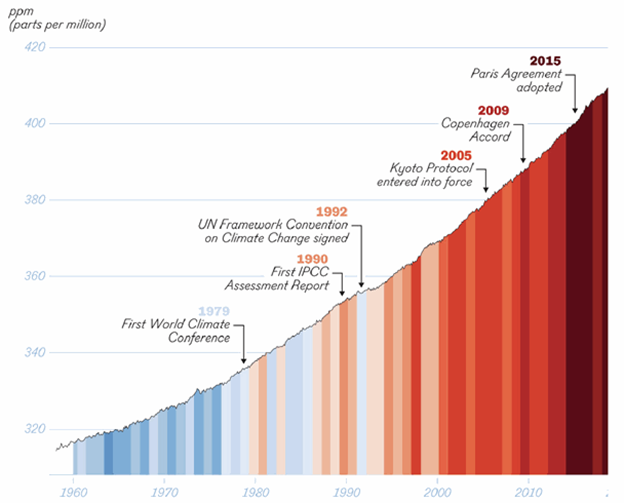
Step forward Charles David (Dave) Keeling. With new instruments and a painstaking series of measurements in the pristine air of both Antarctica and at the top of the Mauna Loa volcano in Hawaii, he nailed down precisely a stable baseline level of CO2 in the atmosphere. In 1960, with only two full years of Antarctic data in hand, Keeling reported that this baseline level had risen. The rate of the rise was approximately what would be expected if the oceans were not absorbing most industrial emissions. Keeling also understood immediately that the curve is jagged (see graphic below) because there are more plants in the Northern Hemisphere and they take up CO2 as they grow in Spring and Summer, and release it as they decay in Autumn and Winter.
Lack of funds soon closed down the Antarctic station, but Keeling managed to keep the Mauna Loa measurements going with only a short hiatus. As the CO2 record extended, it became increasingly impressive, in those days increasing by about 5 ppm per decade. Today the rate of increase is 25 ppm per decade.
The Great Acceleration
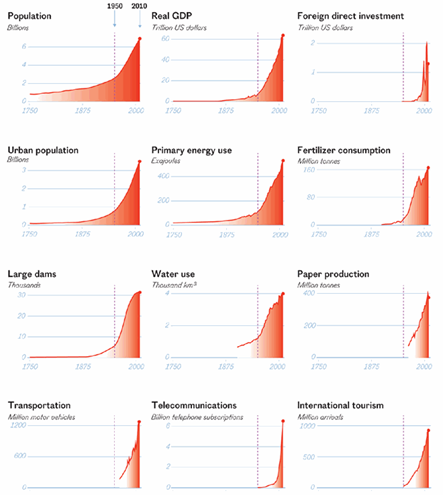
Even by the 1950s, it was not foreseeable how rapidly and intensively the industrialisation started by a few countries in 1750 would spread globally over the next 70 years. This is now known as the great acceleration; since 1950, it has supercharged impacts on both earth system and socio-economic trends as shown by the graphics below.
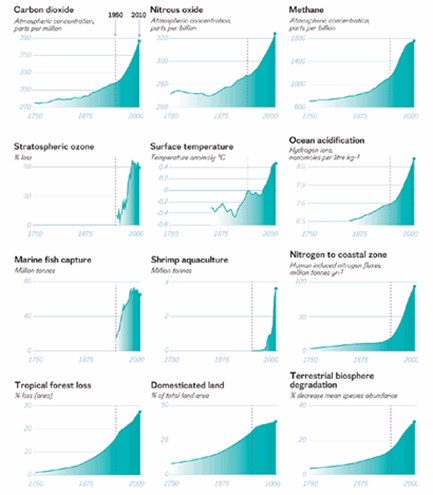
To focus just on CO2, the more granular graphic below highlights both an acceleration in the rise of the measured concentration level and its consequence for average global temperatures. The efforts of humanity over the last 40 years to arrest this trend are also flagged and on any empirical basis cannot be said to be working. This has given rise to a mantra that, despite the science, the climate crisis has never once been treated as a crisis. Such a conclusion can only have been reinforced by everyone’s experiences of the possibilities raised by worldwide governmental responses to another crisis, covid-19.
As Greta Thunberg says in her book pp90-91: “Every once in a while, our leaders make pledges and set a variety of vague, non-binding often distant targets. Then as soon as they have failed to reach them, they immediately set some new ones. And on it goes. It may seem absurd but it most definitely works – if your aim is to maintain business as usual, economic growth and high popularity ratings….The media long for positive news as part of their policy of both-side reporting. It can’t all be doom and gloom! We are actually trying really hard, there has been a lot of progress, so stop being so negative all the time”.
Climate model predictions
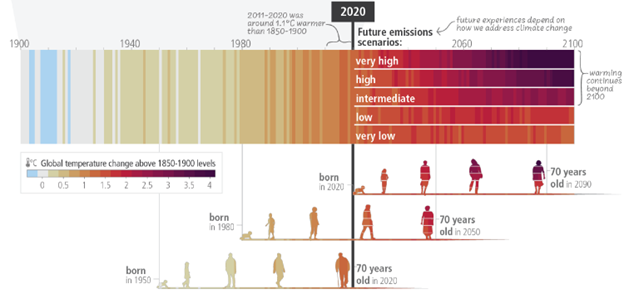
It needs to be said that although the world is today experiencing the impacts of about 1.2⁰C warming, and these are severe enough, the existential threat is foreseen as a possibility/probability/certainty (choose your word depending your optimistic or pessimistic nature) in the future, specifically within the typical lifespan of someone born today (rather than the much longer term of the 22nd century or beyond). The risks are assessed by climate models. The current scientific (IPCC) consensus was summed up at the COP27 summit at Sharm el-Sheikh, Egypt in November 2022 by none other than the Secretary General of the UN, Antonio Guterres: “We are on a highway to climate hell with our foot still on the accelerator”. The basis for such a dramatic if not hyperbolic statement was the latest IPPC modelling which shows current policies are heading to 3.2⁰C warming by 2100. This is evidenced by the graphic below showing the expected level of future greenhouse gas emissions up to 2100.
emergency.travel.documents@notifications.service.gov.uk
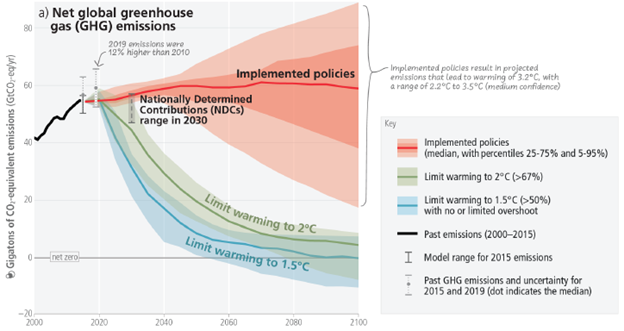
There are two striking features in the above graph. First the huge uncertainty in the projected level of emissions in 2100 (and to a lesser extent in 2050). Secondly, the huge difference in trajectories between the projections assuming current policies and the projections of what needs to happen to emissions if warming is to be limited to 1.5 or 2⁰C: there is no time for a flattening out of the rising line and then a steady descent. What is required is a handbrake turn.
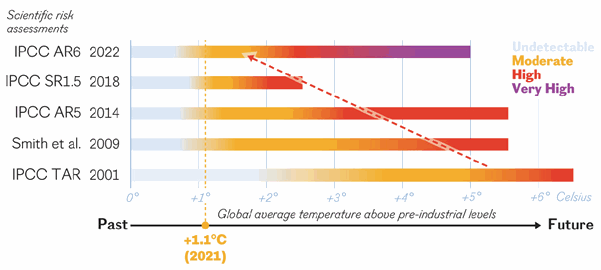
A significant underlying cause of this rather bleak picture seems to be that as climate models get better (more understanding and realistic representation of the complex physical processes, massive increases in the computing power available), their projections of the risks of severe impacts become more pessimistic. With each new IPCC assessment, while warming has increased due to rising GHG emissions, the science is showing the temperature threshold of high risk has gone down (see graphic below). Less than a decade ago, 2⁰C was seen as an “acceptable” target. Now it is categorised as a dangerous risk – the reason why the world is now desperately trying to ‘keep 1.5 alive’.
Some observers have suggested climate scientists have historically been too conservative in either their models or their presentation of results, or indeed both, tending to prefer to understate the severity of outcomes rather than risk exaggerating them (and being accused of crying wolf). One consequence is that events (bush/forest fires, flood, drought, etc.) previously expected (in the mathematical probability sense) by mid 21st century are happening already. But let’s not blame the messenger. The fact is that the risk landscape is worsening the more we learn how the climate system works.
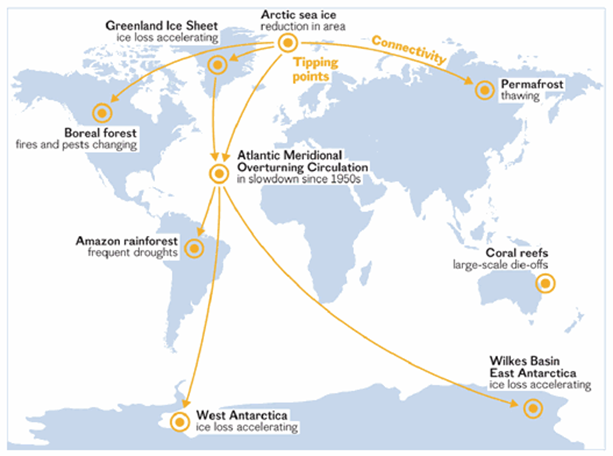
A very different risk regime is represented by a group of low probability, high impact events. These have in the past been viewed more as concerns for the next millennium or science fiction like The Day after Tomorrow 2004 film based on the 1999 book The Coming Global Superstorm. Now the science is beginning to suggest that the tipping elements that need to remain stable and resilient (see graphic below) are showing signs they may be approaching tipping points and a tipping cascade.
Climate modelling uncertainty
A starting point for any run of a climate model is to define some of the fundamental ‘boundary conditions’ to be assumed typically up to 2100. Foremost amongst these is a projection of how much of each climate or radiative forcing greenhouse gas will be emitted year on year in the future (land use changes fall into the same category but are not considered in this article). The uncertainties and so the huge spread of the possible envelope of annual GHG emissions mentioned above are unavoidable:
- Policies will evolve, hopefully becoming more stringent year on year, if/when the emergency deepens
- Future compliance with policy in each country has to be assessed realistically along with the potential for bad actors.
The next step for the model runs is to translate future emissions scenarios into impacts:
- Headline global average temperature rise is but one, even if it is now the most iconic
- But also sea level rise, extreme weather events, etc
- And all the feedback loops including from albedo changes and climate’s effects on weather
It is worth mentioning that the robustness of a climate model’s projection of the future can in fact be partly indicated even quantified by running the model over the past, for example from 1950 up to the present day. These runs benefit from near certainty about the boundary conditions (we have records of or can estimate how much of each greenhouse gas was emitted each year in the past, etc) and the outputs can be compared with, even calibrated against, observed outcomes for the past. Saying climate models are continually and markedly improving is based on such hard evidence, not just wishful thinking given the future is unknowable.
Anyone who has read IPCC reports will be aware they are riddled with caveats which quantify the likelihood of the future turning out in the way the model projects. Uncertainties in impacts can be assessed by multiple runs of a model, each with different permutations of influential parameters. Two metrics are used for communicating the degree of certainty:
- Confidence: scientific judgement about validity of findings through evaluation of evidence
- Likelihood: quantified measure of uncertainty in a finding expressed probabilistically.
One final observation on models, channelling the ‘exam question’ mentioned at the beginning. A key outcome modellers want to predict reliably is the global mean equilibrium warming, or ‘equilibrium climate sensitivity’, for a doubling of the CO2 concentration in the atmosphere since the pre-industrial era. The current consensus is it is likely to lie in the range 2°C to 4.5°C, with a most likely value of about 3°C. That is about half the estimate made by Arrhenius in 1896 and 50% higher than Callendar’s estimate in 1938. The answer is of fairly immediate concern: at the current rate of increase (25 ppm/decade), this milestone can be expected to occur around 2080.
Equity
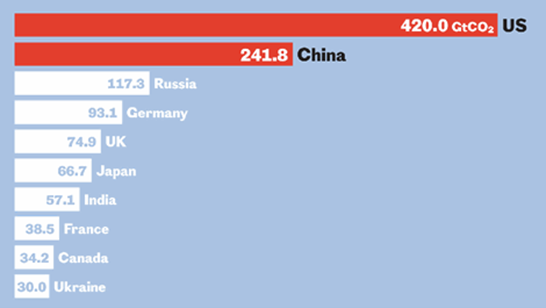
It is undeniable that responsibility for historical emissions is not shared equally. At a national level, a few countries stand out as vastly more responsible for historical emissions than others. The highest 4 emitters have produced a half of the historical total, whilst the top 10 are responsible for over two thirds.
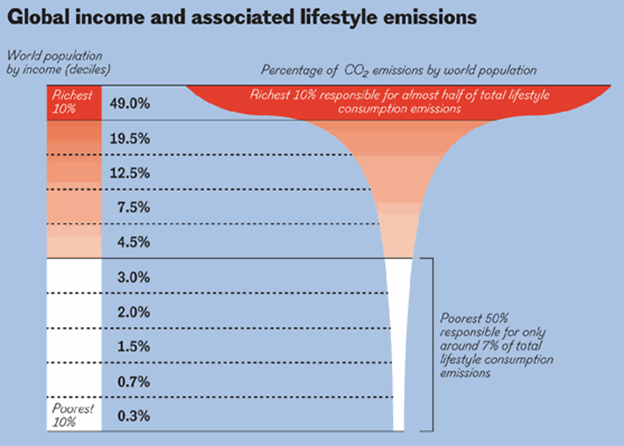
Obviously, any narrative around country level emissions must be nuanced by their population numbers over the accounting period. And it is probably more useful to compare the emissions of each member of the human race. For example, it is estimated that almost half (49%) of the world’s current annual total emissions are created by just 10% of humanity; and 15% of the total is produced by the richest 1%, as illustrated in this graphic:
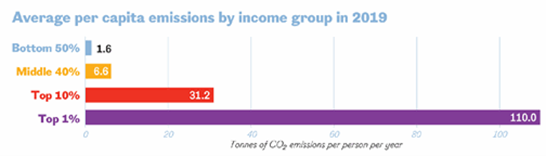
Perhaps one of the most striking statistics about equity or lack thereof is that if the top 10% of global emitters cut their footprint to the EU average (amber bar in graphic below), global emissions would reduce by one third.
More soberingly, to stay in line with our international climate targets we need to get our individual per capita emissions down to somewhere around 1 tonne of CO2 a year; the current mean for each of the 8 billion global population is 4.3 tonnes per year. In Sweden, that figure currently stands at around 9 tonnes, once you include consumption of imported goods (but excluding biogenic emissions from wood burning, etc.). In the US that figure is 17.1 tonnes, in Canada 15.4 tonnes, in Australia 14.9 tonnes, in the UK 10 tonnes and in China 6.6 tonnes.
Greta Thunberg’s advocacy for ‘Climate justice now’ is searing: “The Industrial Revolution, which was fuelled by slavery and colonisation, as well as fossil fuels, brought unimaginable wealth to the Global North. That injustice is the foundation that our modern societies are built upon. The sufferings of the many have paid for the benefits of the few. Their fortune came at a price – including ecological destruction and climate instability. There is a bill for all this destruction that has not yet been paid. In fact, it hasn’t even been added up; it is still waiting to be invoiced.”
So why does this matter? Why not, in an emergency, let bygones be bygones and get on with finding solutions to the problems? Why make things more difficult by bringing up some of the most complicated issues in the history of humanity?
Around 90 per cent of the CO2 emissions in our entire carbon budget have already been emitted. It might seem obvious this should be at the centre of our climate negotiations, or at least have some effect on the global discourse. But, it is tempting to ignore them, as they will make a bleak message appear far bleaker. The prospect of Global North nations reaching net zero by 2050 is inadequate if you include historical emissions. But the idea of reaching net zero emissions in three decades is already considered extremely radical in the US discourse. The problem, however, is that to make the Paris Agreement work on a global scale we have to include equity and historical emissions. There is no way around it. ”
Source: pp19-20, The Climate Book created by Greta Thunberg, 2022
Perhaps an equally important consideration should be inter-generational justice: the extent to which current and future generations will experience a hotter and different world depends on choices made now, as the latest IPCC report highlighted:
One of the essays in The Climate Book (pp306-307) is by Nicolas Stern, a former chief economist at The UK Treasury and now Chair of the LSE’s Grantham Research Institute. He wrote The Stern Review (2006) a seminal analysis of the Economics of Climate Change. In his essay, he observes “The economic analysis of climate change has grossly undervalued our descendants’ lives through a misleading and ill-founded approach to discounting. We have discriminated against future generations based on their date of birth.”
Other greenhouse gases and aerosols
Although CO2 is responsible for half the global warming experienced to date and will be the cause of most (90%) of projected future warming, other anthropogenic greenhouse gases are very important, as quantified in the graphic below. These include non-CO2 gases like:
Methane
NOx
Halocarbons such as chlorofluorocarbons (CFCs) and hydrochlorofluorocarbons (HCFCs)
VOCs
- Carbon Monoxide
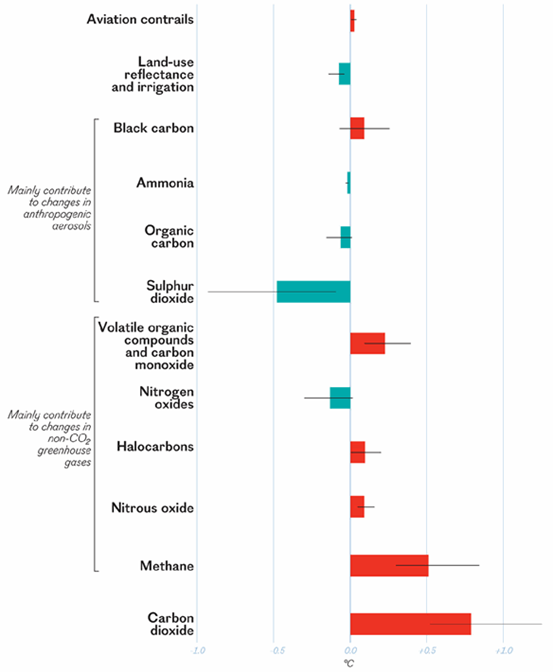
As can be seen in the above graph, global warming is also affected by anthropogenic:
- Aerosol
- Sulphur dioxide
- Particulates
- Black carbon
- Contrails
Aerosols cause pollution hazardous to health but most also reflect sunlight back to space and make cloud whiter and more reflective. Dark aerosols, like smoke particles, can absorb sunlight and heat the air around them. Dark aerosols on snow reduce its reflectivity and speed up melting. Overall today, the IPCC calculates aerosols have a net cooling effect of 0.5°C, as well as impacting global weather. But aerosols are not fully understood which is a problem as we expect their concentration to reduce as we phase out coal-fired power stations and diesel cars. It might sound tempting to leave the cooling aerosols as they are or even emit more of them but that is not an option if we want to cut the CO2 emissions they are associated with. The elimination of fossil-fuel use to reach net zero will inevitably lead to cleaner skies which is good news for our health, but at the same time it will be the cause of collateral damage as their absence will speed up surface warming and cause more extreme weather.
Methane
A startling fact that is only starting to be more widely appreciated is that about a third of historical warming is due to methane. Methane (CH4) is a much more powerful greenhouse gas than CO2 but behaves very differently. Due to chemical reactions, 80% is removed from the atmosphere within 20 years and virtually all within 40. By contrast, CO2 that is not absorbed by land and ocean sinks remains forever (unless humanity succeeds in applying ‘Direct Air Capture’ at scale). The long-term CO2 concentration is driven by cumulative emissions. Cutting CO2 emissions only slows the increasing rate of warming until we get to net zero, whilst waiting to cut CO2 emissions locks in future warming.
By contrast, warming produced by atmospheric CH4 reflects the current rate of emissions and cutting methane emissions results in near immediate temperature declines. The IPCC says we need to cut anthropogenic methane emissions by half by 2050 to reach net zero by that date. The graphic below illustrates again how that means a massive change in direction from the path (red line) expected under current policies:
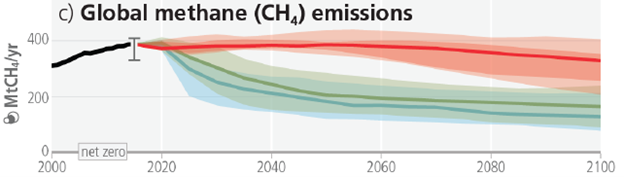
A UNEP Global Methane Assessment in 2021 predicted that globally, anthropogenic methane emissions are expected to continue to increase under current policy scenarios by 15% by 2030. This is somewhat out of alignment with the IPCC prediction of flatlining to 2050 shown in the above graphic.
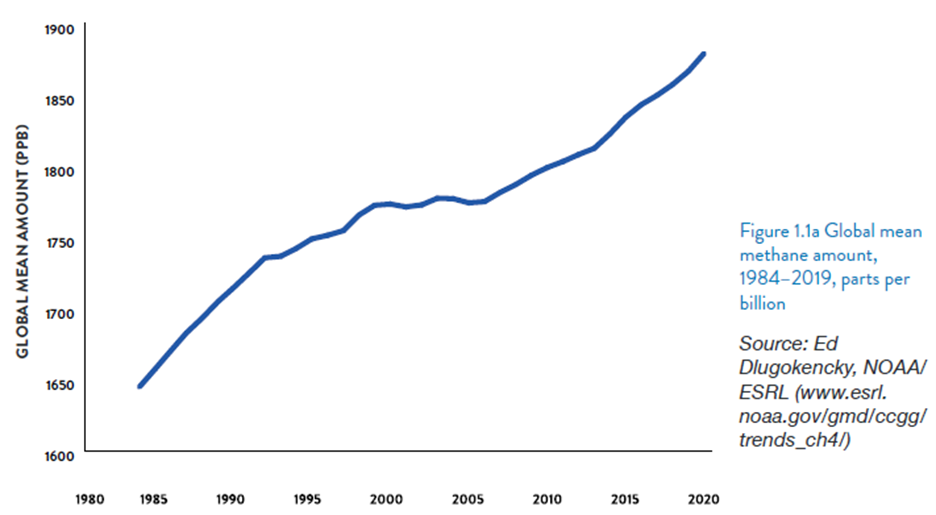
What we do know is that the atmospheric concentration of methane has more than doubled since pre-industrial times. These increases are due to growth in anthropogenic emissions rather than a slower atmospheric removal rate. Over the past four decades, methane levels increased sharply in the 1980s, flat-lined briefly from 2000 - 2005 when emissions and sinks were roughly balanced, but increased rapidly again over the past decade due to fossil fuel-related activities (see graphic below). A significant part of the problem is caused by producers who release excess methane into the air unburned, a somewhat unintended consequence of highly visible gas flaring being criticised. Recent developments in satellite technology have enabled the venting of the invisible gas to be detected.
Methane also contributes to the formation of tropospheric ozone (O3), another short-lived but powerful greenhouse gas and surface ozone, an air pollutant with detrimental effects on people, ecosystems and crops.
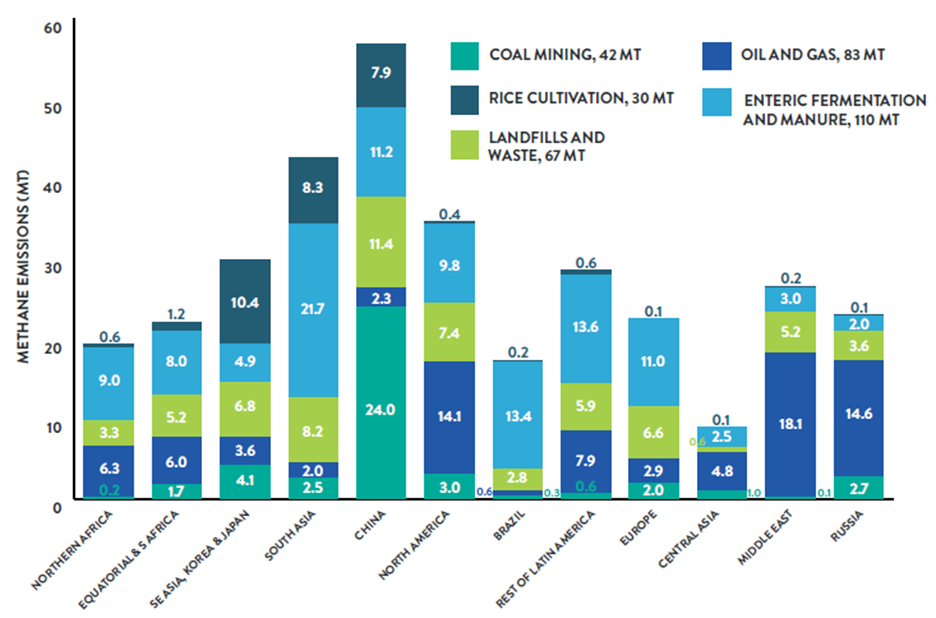
About 95% of total global methane emissions from anthropogenic sources come from just 3 sectors: fossil fuels 35%, agriculture 40% and waste (landfill) 20%. The sources are spread across the world as shown in this graphic.
Substantial methane emissions also occur naturally: currently they amount to 40% of the global total. Sources include freshwater bodies, oceans, termites and wetlands as well as wildfires and thawing permafrost. But as with most climate science, things are not that simple as both human induced climate warming and land-use changes affect how much methane is emitted by these natural sources.
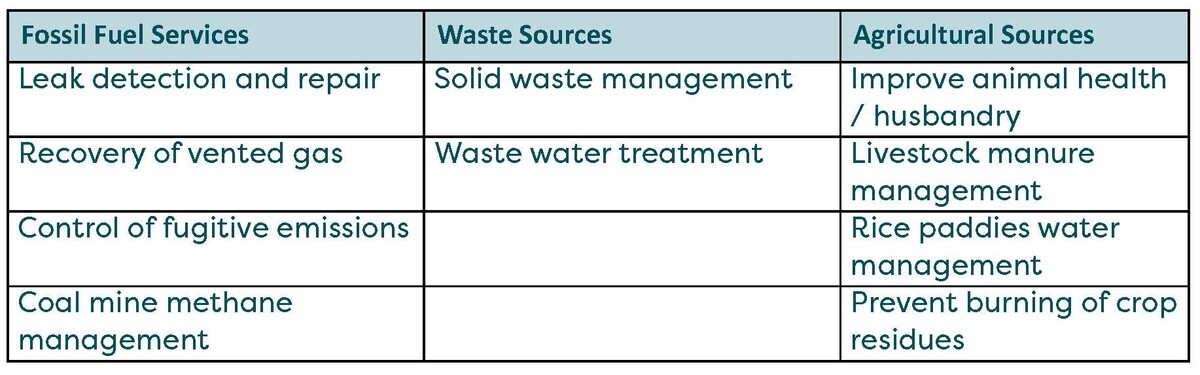
The UNEP assessment showed emissions can be reduced by 45% this decade using well-proven means. This would avoid 0.3°C warming by 2045, contributing enormously to the Paris Climate Agreement’s 1.5˚C goal. Mitigation measures are summarized in the table below.
Conclusions
The science of climate change is not easy to summarise concisely. Hopefully, this article provides a useful primer in a 15 minute read. For anyone inspired to delve more deeply, I recommend The Climate Book.
In a new study published this week by the UKBCSD (UK Business Council for Sustainable Development) their chair Jason Longhurst says "Today, more than 90 per cent of global GDP is covered by some form of net zero target". I worry the majority are vague, non-binding pledges (as Greta would say) but, to end on a more positive note, others will be convinced that gives us grounds for optimism.